INW
Avalanche Radar System
Results:
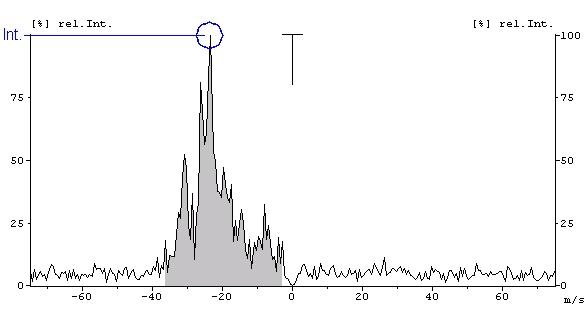
Velocity at maximum echo intensity and maximum velocity:
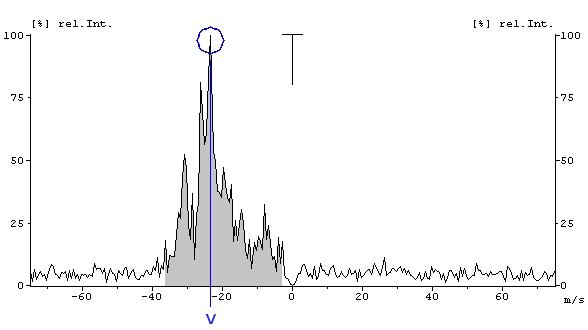
Fig. 7: Velocity at maximum echo indensity (©
IBK, TU-Graz)
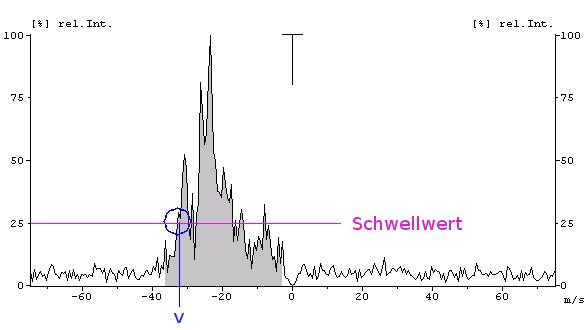
The velocity at maximum echo intensity is shown in Fig. 7. The maximum velocity
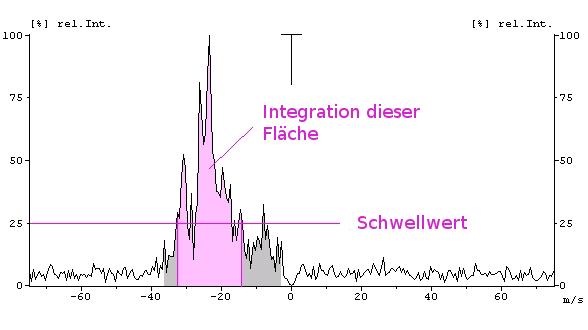
is the highest velocity in the spectrum, which is measured at a threshold.
This threshold is a multiple of the noise floor as shown in Fig. 8.
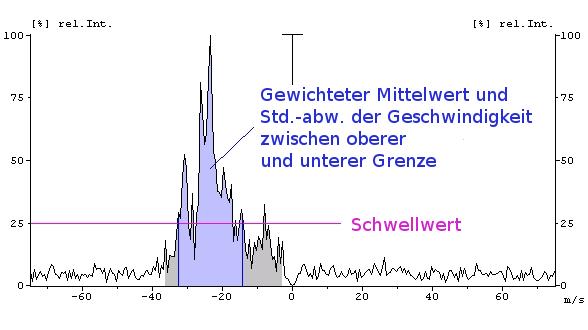
Mean Velocity and Standard deviation:
The mean velocity is a weighted average of spectra lines. These spectra
lines are part of an area which is defined by an upper and lower boundary.
These boundaries are calculated dynamically and the corresponding velocities
are the highest / lowest velocity of an echo signal which passes the threshold.
The standard deviation is calculated with the mean velocity.
Fig. 9: Mean velocity and standard deviation (© IBK, TU-Graz)
Maximum echo intensity and overall echo intensity:
The maximum echo intensity is the highest echo signal in the spectrum (see
Fig. 10). The overall echo intensity is calculated by an integration of all
echo signals in an area, defined by upper and lower boundaries for the threshold
(see Fig. 11).
Fig. 8: Maximum velocity (© IBK, TU-Graz)
Fig. 10: Maximum echo intensity (© IBK,
TU-Graz)
Fig. 11: Overall echo intensity (© IBK,
TU-Graz)
