Avalanche Radar - Display

The "online" or "live" echo data of a measurement can be displayed in three different ways:
- Photo View
- Velocity View
- Spectra View
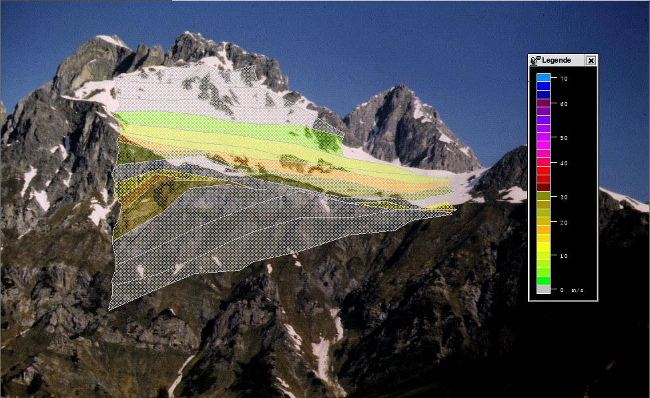
Photo View
The photo view shows a photo of the avalanche track with the projected range gates inside. The area of the range gates are
filled with a color corresponding to either the maximum velocity or the velocity at the maximum intensity.
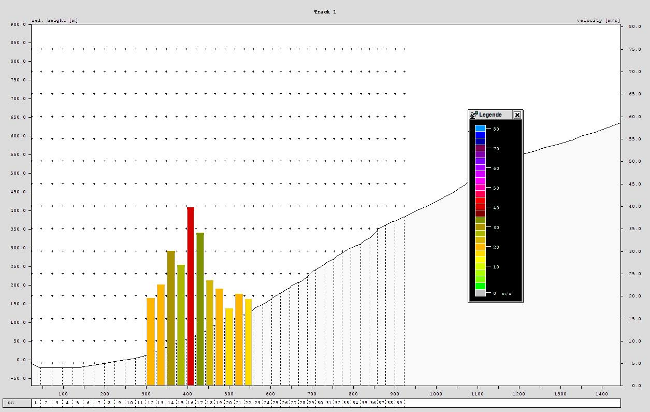
Velocity View
The velocity view shows the profile of the avalanche track divided into the different range gates. Each range gate shows a bar
whose height and colour depends on the measured velocity of the rangegate. So the information is the same as in the photo view
above.
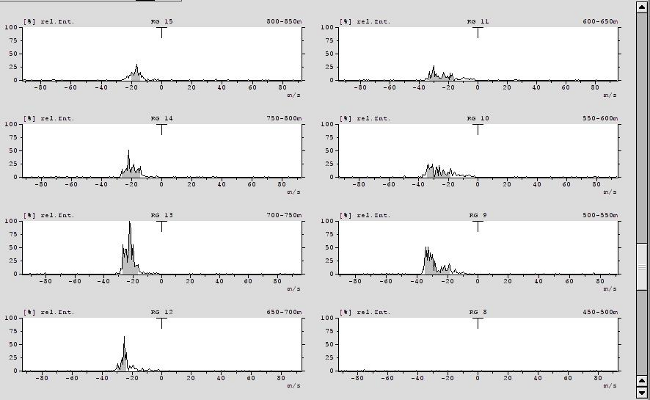
Spectra View
The spectra view shows the doppler velocity spectra for all range gates during the measurement. The display shows more then one
diagram (= range gate) on the screen so that a larger portion of the avalanche track can be observed simultaneously.